Nov. 2, 2022
Overview: Recession News Is Not Getting Better
The S&P500 was blessed with an 8.1% bear market rally in October but lost 3.1% of it in the first two days of November when the Fed hiked interest rates another 75 basis points. Fed Chairman Powell renewed his hawkish stance and warned that it was “very premature” to talk about a pause in rate hikes. Last Friday, a few well-known Wall Street chieftains summarized the US economy and markets this way:
- Inflation isn’t going away
- Prepare for more chaos
- Wait for signs of peak fear
- The ‘super bubble’ is still bursting
- Bonds should bounce back
Professional traders generally believe that the VIX volatility indicator must exceed 40 to confirm the peak fear and capitulation required of a true market bottom. Currently, the VIX is only at about 25, indicating that the market bottom is likely still lower.
Optimists who view strong consumer spending and $3.4 Trillion of government spending in just the last two years as bullish for the market miss the point that the Fed views these excesses as inflation’s root cause: too much money chasing too few goods. While Jerome Powell admits to starting rate hikes too late, he is now determined to do whatever it takes and warns that it may be painful for all. Signs that inflation is under control may include (1) individuals no longer feeling the market’s wealth effect, (2) consumer demand for goods declines, (3) both production and investment for expansion decline, (4) lower earnings reports drive share prices down, and (5) fear of job security takes root.
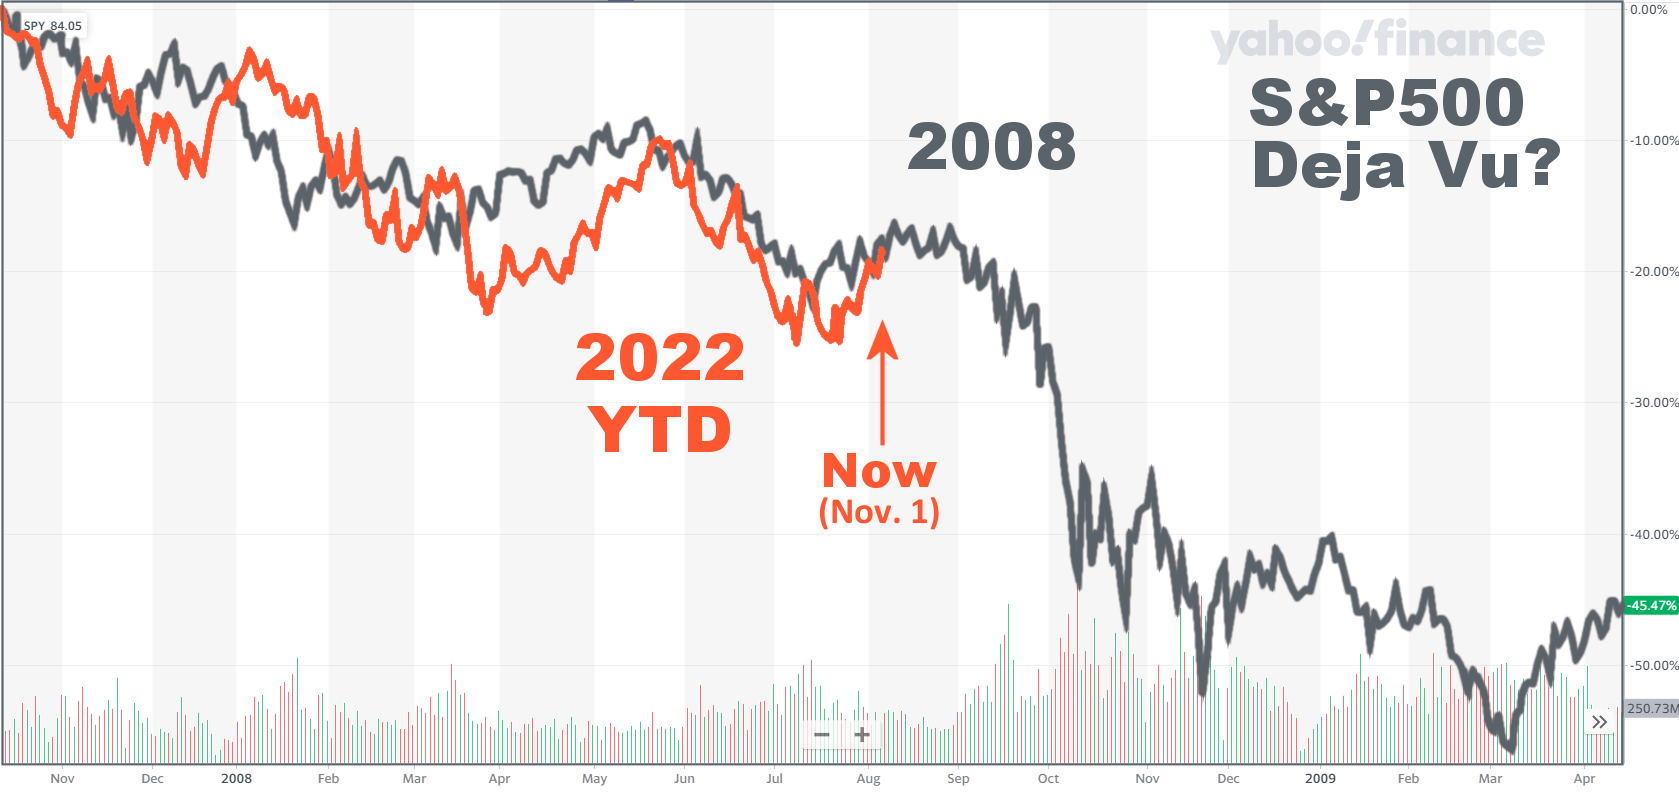
Given that the tight global energy supply will almost certainly worsen this winter, that Russian aggression is only increasing, and that the Fed vows unrelenting hawkishness, we believe that it is much more likely markets will get worse before they get better. Similarities to the 2008 crash continue. Stay Buckled up and “Don’t fight the Fed.”
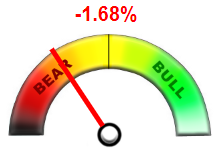
StormGuard Remains Pessimistic
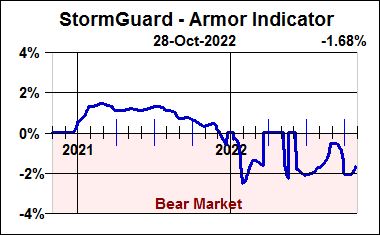
Our StormGuard indicator remains quite negative, although it has recently turned a bit upward in response to October’s minor bear market rally. As we dive into the holiday shopping season, Fed Chairman Powell may find himself characterized as the Grinch Who Stole Christmas. Nothing would make him feel more accomplished in his quest to curb inflation than to successfully put a strong damper on any “excess money chasing goods” this shopping season.
Strong retail sales reports will result in the Fed raising rates even higher. Conversely, if retailers do somewhat poorly, it may be the sign the Fed is looking for to pause interest rate hikes in February. Investors, on the other hand, may respond to poor retail sales by selling stocks of the corresponding retailers and manufacturers and eventually trigger a tax-loss harvesting selling binge in late December. Stay Buckled up.
Still Tracking the 2008 Crash
In the chart below, the 2022 YTD S&P500 performance is correspondingly overlaid on the 2008 bear market S&P500 performance. The Fed’s 0.75% rate hike yesterday was served up firmly with no near-term expectations of pivoting from their plan. The bears appear to have regained control of the markets. With economic news deteriorating and no sign of capitulation in sight, the market appears poised for another leg down.
“History Doesn’t Repeat Itself, But It Does Rhyme.” Mark Twain
This Could Play Out Again
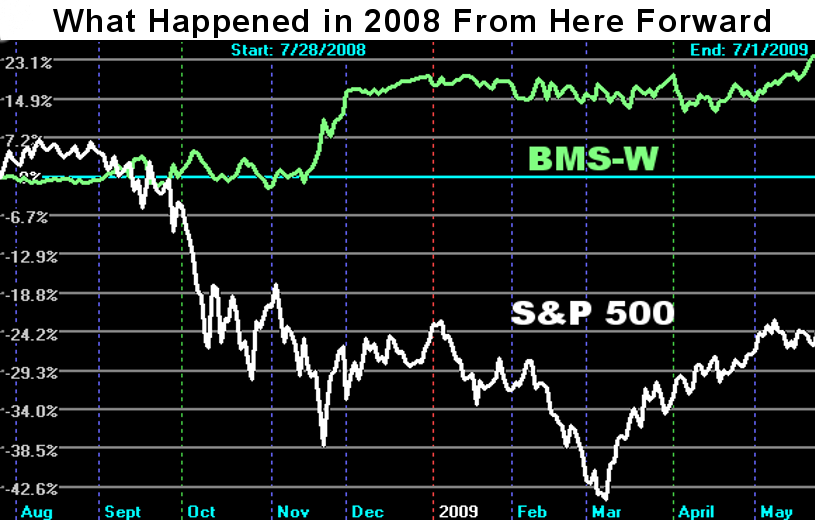
The black chart (right) aligns time-wise with the white chart (above) and includes the performance of StormGuard’s BMS-W (Bear Market Strategy) relative to the S&P 500 for the remainder of the 2008 bear market. The strong pop in BMS-W seen during capitulation is caused by a combination of the Fed quickly reducing rates and a massive flight to safety from equities to treasuries. If the Fed’s hawkish actions again produce a capitulation selloff and Bear Market Strategies behave as they previously have, six months from now we will have avoided capitulation and captured the Fed-induced treasury bounce.
What The VIX Tells Us
When the VIX Volatility Index exceeds 40, it is believed to be a sign of capitulation indicating that fear is rampant and that rapidly declining prices may be producing margin calls that trigger further selling in over-leveraged investment accounts. There are three pairs of green lines on the chart marking somewhat elevated periods of volatility where the VIX appeared range-bound (between 20 and 30) for nearly a year. Similar market declines occurred during all three instances. They were followed by a market crash only in the first two instances. Soon we’ll know whether investor fears will trigger a similar crash, or whether the Fed will successfully execute a “soft landing.”
VIX Volatility Index
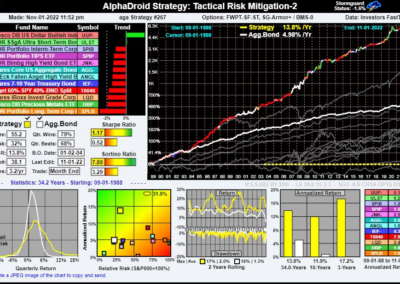
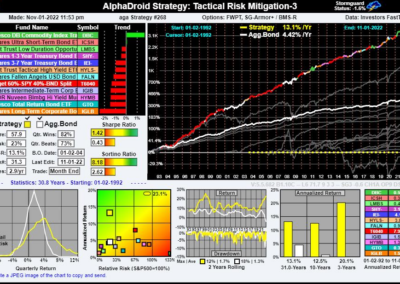
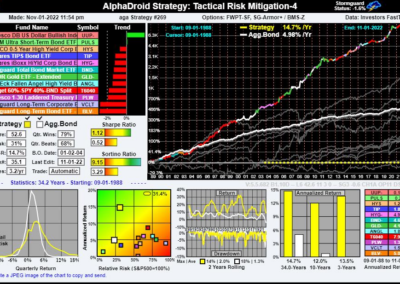
Presenting: The Tactical Risk Mitigation Index
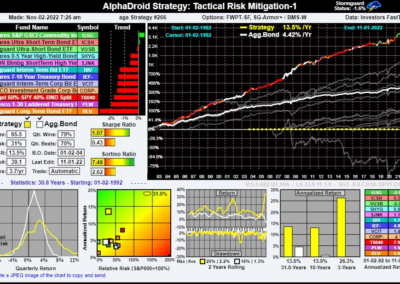
Given the recent unprecedented correlation between bonds and equities during this market crash, some of you challenged us to go back to the lab, put on our thinking caps, and find more ways to reduce portfolio risk. So, we did … it’s what we always do. The Tactical Risk Mitigation Index (below) was developed specifically to be an improvement to our existing Tactical Growth and Income Index.
The Tactical Risk Mitigation Index is a portfolio of four underlying momentum Strategies, each making a fund selection for the portfolio to hold. Each momentum Strategy employs three primary risk reduction methods:
- Each Strategy employs StormGuard-Armor and one of four different Bear Market Strategies.
- Each Strategy employs a moderate 60/40 portfolio as its backbone fund to reduce equity risk.
- Each Strategy employs a range of defensive asset class funds to directly challenge the backbone.
An analogy would be that StormGuard-Armor is like posting a trained Doberman in your front yard to defend your home. The 60/40 backbone fund is like putting on some body armor to reduce trauma in case of a fight. Directly judging a set of defensive asset class funds against the 60/40 backbone is like posting a second trained Doberman in your backyard to ensure that the back door has sufficient coverage.
Lower Risk than AGG
Higher Return than SPY
Best All Weather Index
Each of the four underlying strategies begins with the T6040 (Target Allocation 60/40) portfolio as its backbone. Other candidate funds in each strategy include commodities and a variety of durations of treasuries, TIPs, aggregate bonds, corporate bonds, and high-yield bonds. The Painted Path charts identify the currently active risk mitigation principle.


May the markets be with us,
Disclaimers:
Investing involves risk. Principal loss is possible. A momentum strategy is not a guarantee of future performance. Nothing contained within this newsletter should be construed as an offer to sell or the solicitation of an offer to buy any security. Technical analysis and commentary are for general information only and do not constitute a personal recommendation or take into account the particular investment objectives, financial situations, or needs of any individual. Before investing, carefully consider a fund’s investment objectives, risks, charges and expenses, and possibly seeking professional advice. Obtain a prospectus containing this and other important fund information and read it carefully. SumGrowth Strategies is a Signal Provider for its SectorSurfer and AlphaDroid subscription services and is an Index Provider for funds sponsored by Merlyn.AI Corporation. SumGrowth Strategies provides no personalized financial investment advice specific to anyone’s life situation, and is not a registered investment advisor.


