Sept. 29, 2022
Overview: Worse than a Normal Recession?
The S&P500 lost 15% since the Bear Market Rally peaked in mid-August, and has just retested the mid-June market low and today is heading lower. Jim Cramer of CNBC recently stated,
“We’re now in ‘good news is bad news’ mode, because the Fed’s not going to stop bringing the pain until we see real deterioration.”
Morgan Stanley strategists warned on Monday that the recent rally in the U.S. dollar is creating an “untenable situation” for riskier assets that could end in a financial or economic crisis. Morgan Stanley further warned on Wednesday that a corporate earnings recession may be coming that could be worse than a “normal” recession. Until the VIX volatility indicator exceeds 40, professional traders generally won’t believe there has been sufficient capitulation to confirm a market bottom. Currently the VIX is at about 30, indicating that the market bottom is quite likely lower. Slowing the economy means business revenues drop, earnings shrink, and stock prices follow suit. Similarities to 2008 abound. Buckle up and “Don’t fight the Fed.”
Buckle Up Options
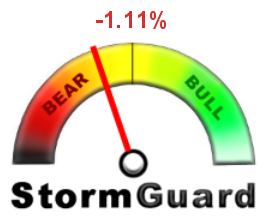
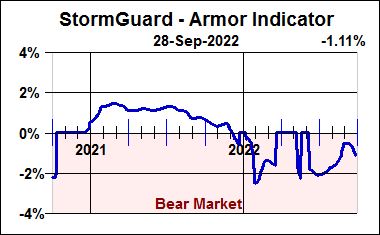
Our StormGuard indicator remains negative and is declining. Unfortunately, proficiently buckling up in 2022 has been quite a challenge – sharply rising interest rates have pummeled bond and treasury funds concurrent with the ongoing decline in the equities market. Many professionals are beginning to question the future viability of the classic 60/40 portfolio. The BlackRock 60/40 Target Allocation Fund (BIGPX), for example, is now down 20.6% YTD. Even the SPDR Gold ETF (GLD) has declined similarly over the past 7 months.
The 10% summer rally in long-term Treasuries was among factors that led a number of our Bear Market Strategies to select from this category in September. However, the Fed surprised many in September with the seriousness of its hawkish stance on inflation and interest rate hikes resulting in the further decline in bonds and treasuries. The two primary options for buckling up are described below.
Buckle Up: Basic
While StormGuard seeks to determine when equities markets appear to be bullish or bearish, the purpose of a Bear Market Strategy is to evaluate defensive fund candidates when StormGuard is triggered. We have recently reviewed our many posted Bear Market Strategies (that you may integrate into your own equity Strategies) to ensure their defensive candidates include a robust range of short-term to long-term bond options. At this time, it appears that the more stable shorter-term bond candidates will be favored. If your Strategies employ an integrated Bear Market Strategy you are buckled up.
Buckle Up: Aggressive
Four of our Bear Market Strategies (BMS-G, BMS-M, BMS-S and BMS-X) employ one or more inverse (short) ETF candidates, such as SH, DOG, MYY, EFZ and RWM. If you believe more market-downside is coming and you want to hedge your portfolio, then employing one of these Bear Market Strategies may be of interest. The algorithms for these four Bear Market Strategies are aware that their fund candidates include inverse funds that will require special validation testing immediately following a market V-bottom that seek to prevent rebound losses.
Note: If you have a combination of taxable and tax-deferred accounts, it will be more tax efficient to execute the hedging trades for your overall account within your tax-deferred account.
What Lies Ahead?
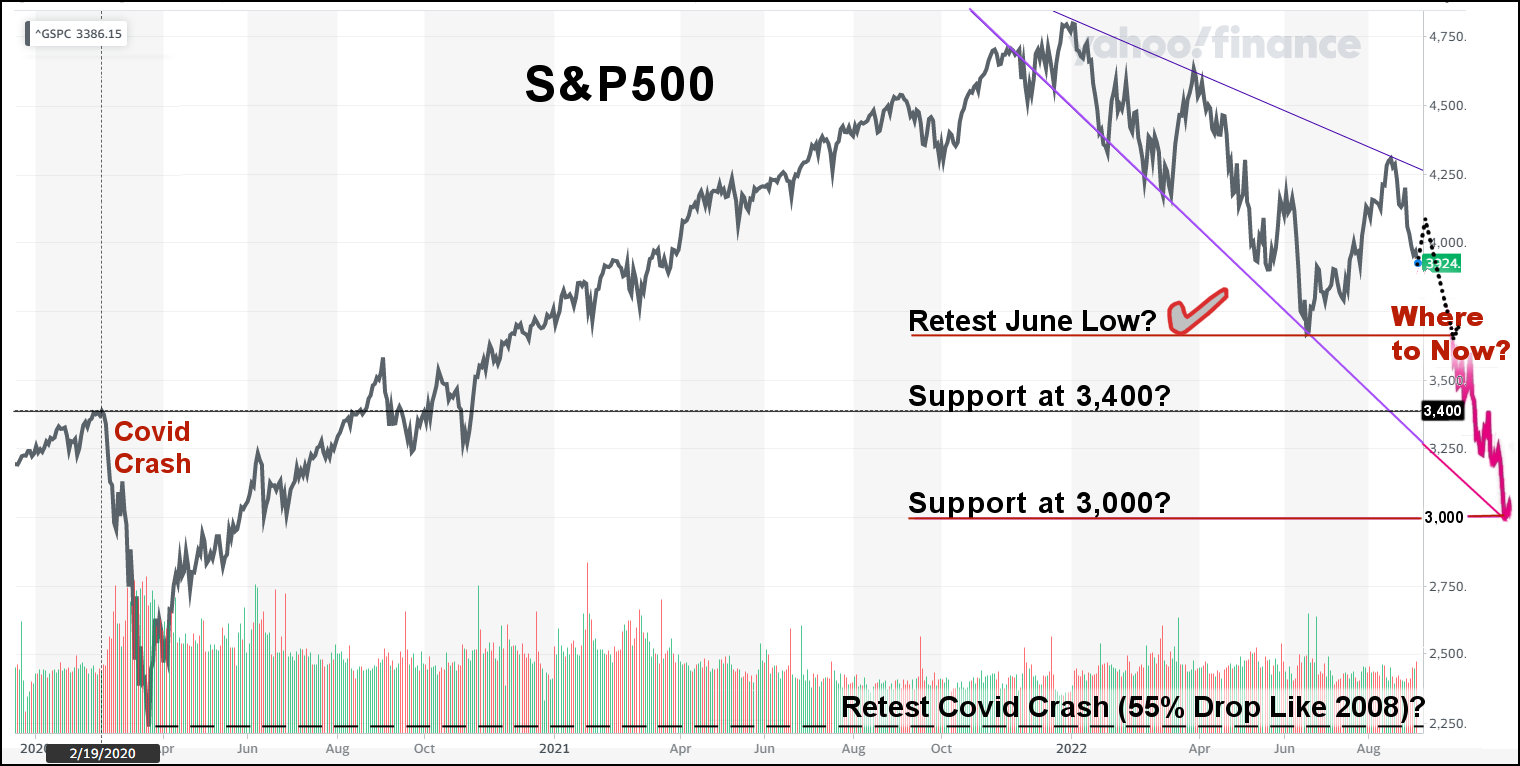
Parking a car with precision would be virtually impossible if there were only a few seconds of delay in your visual perception. Given that most economic indicators have one to six months of lag in response to stimulative action taken by the Fed or Congress, by the time economic indicators are reported and actionable, economic reality is already a few months further down the road. That, by itself, makes a soft landing virtually impossible. On August 31, it was unknown whether or not the market would retest the June lows. Today the S&P500 broke through the June low for a second time this week, resulting in a new 2022 market low. Still, having had no sign of capitulation but having steadily deteriorating economic news, it appears that the market is poised for another leg down.
Three Hypothetical Technical Support Levels for the Market
VIX History
When the VIX Volatility Index exceeds 40, it is believed to be a sign of capitulation indicating fear is rampant and rapidly declining prices are producing margin calls in over-leveraged accounts.
VIX Volatility Index
Learning from History
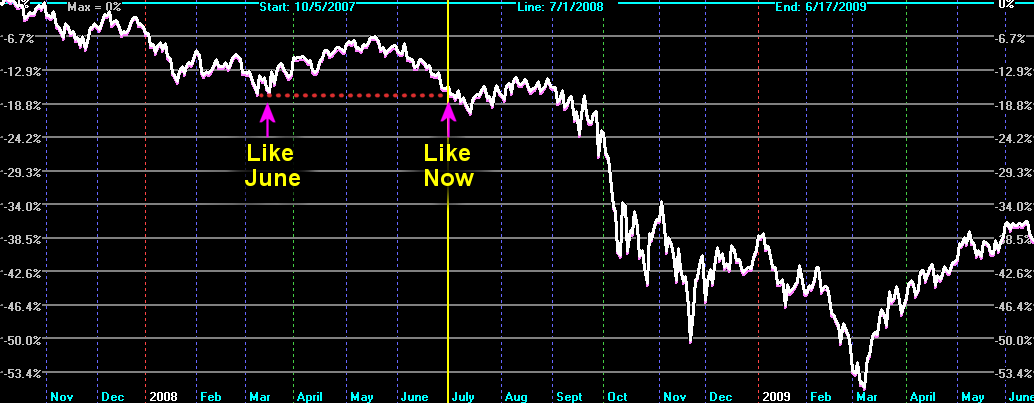
Winston Churchill (among others) is credited with saying “Those who fail to learn from history are doomed to repeat it.” Perhaps the good news is that the demographics, skill level, and emotional response of investors remain fairly constant over time… only their names change over the decades as young ones enter and old ones exit. Perhaps a good analogy for the day is the anatomy and life cycle of a hurricane. No two hurricanes are identical, but we have learned how they grow, move, and destroy things unprepared for their arrival. For now, it seems that Hurricane Powell-22 is shaping up quite similar to Hurricane Bernanke-08. Yogi Berra almost certainly would have quipped, “It’s Deja Vu All Over Again.”
2008 / 2022 – Is It “Deja Vu All Over Again?”
Patience, not panic! Rules, not emotion!

May the markets be with us,
Disclaimers:
Investing involves risk. Principal loss is possible. A momentum strategy is not a guarantee of future performance. Nothing contained within this newsletter should be construed as an offer to sell or the solicitation of an offer to buy any security. Technical analysis and commentary are for general information only and do not constitute a personal recommendation or take into account the particular investment objectives, financial situations, or needs of any individual. Before investing, carefully consider a fund’s investment objectives, risks, charges and expenses, and possibly seeking professional advice. Obtain a prospectus containing this and other important fund information and read it carefully. SumGrowth Strategies is a Signal Provider for its SectorSurfer and AlphaDroid subscription services and is an Index Provider for funds sponsored by Merlyn.AI Corporation. SumGrowth Strategies provides no personalized financial investment advice specific to anyone’s life situation, and is not a registered investment advisor.


