Feb. 6, 2023
Overview: It’s Not Over Until it’s Over
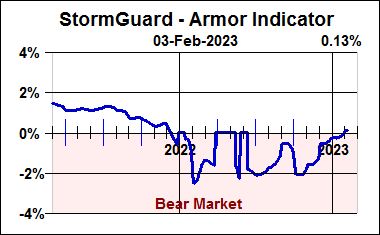
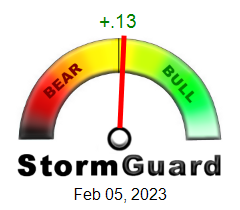
In late January the S&P 500 broke through a pair of resistance levels that technical traders often use as buy-signals: (1) the 50-day SMA (simple moving average), and (2) the line drawn along the tops of a series of recent lower-highs. StormGuard, which was previously negative (bearish), had been rising and turned positive (bullish) just before month-end. Thus, all month-end traded Strategies have moved from defensive funds to bullish equity funds.
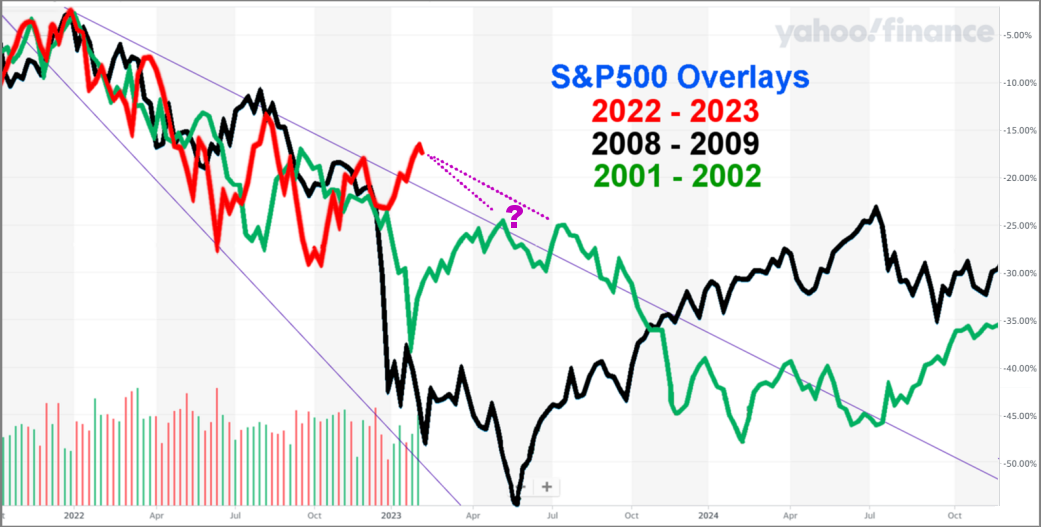
The question to be resolved in the coming weeks is whether this truly marks the start of a new bull market, or turns out to be a deceptive “bull trap” defined as a false signal that reverses after a convincing bear market rally and traps investors that acted on the buy signal and may generate a loss. All technical indicators are designed to improve your odds of making better investment decisions, but unpredictable news events often disrupt the odds. I highly recommend reading at least the Executive Summary of legendary investor Jeremy Grantham’s recent letter: After a Timeout, Back to the Meat Grinder!
Although many mitigating factors could support a softer landing, we must keep in mind that the Fed shows no sign of pivoting away from its aggressive rate hike-and-hold plan and vows not to repeat its stagflation failure of the 70s by moderating too early. The series of charts below tell their own story, suggesting there may be further trouble ahead. In the near term, this bear market rally may persist for another month or so.
StormGuard Gets a Bit Optimistic
Following a pair of failed bear market rallies in the second half of 2022, a third rally in January finally nudged StormGuard into positive territory. Where to from here?
There remain numerous significant unknowns, including the path of the Russian/Ukraine war, a possible winter energy squeeze in Europe, the effects of the massive Covid outbreak in China, the reopening of the Chinese economy, and whether the Fed will again over-play its hand and break something. Fortunately, the markets are not completely random. Momentum and technical analysis are about improving investment performance by tilting selection odds in our favor over the long term. Stay Tuned – StormGuard is Watching.
Inflation vs Fed Funds Rate
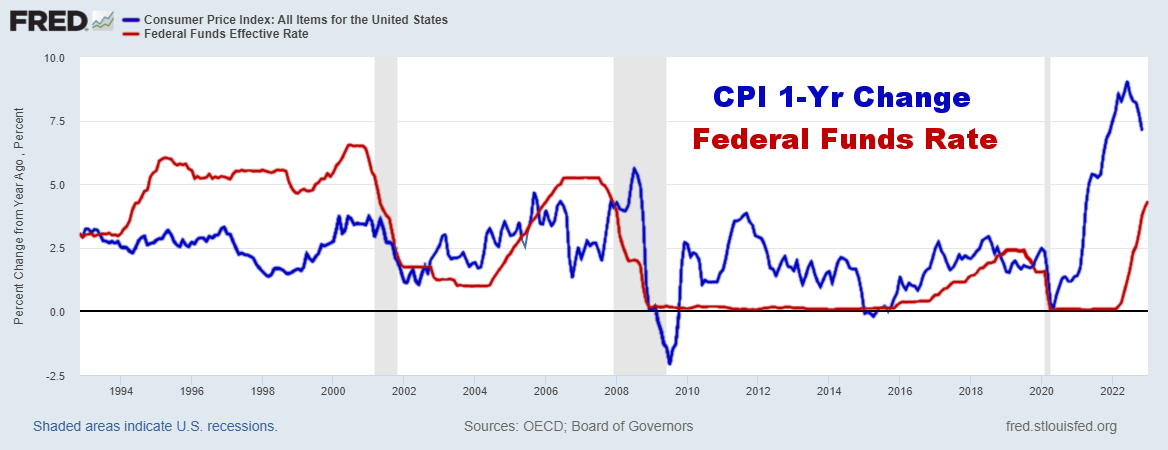
In past periods, interest rates at least as high as the inflation rate were required to reliably bring down inflation. It’s hard to distinguish the current mild decline in inflation from other periods where such short and minor declines proved to be no more than ordinary fluctuations unrelated to Fed actions.
Recession Prediction
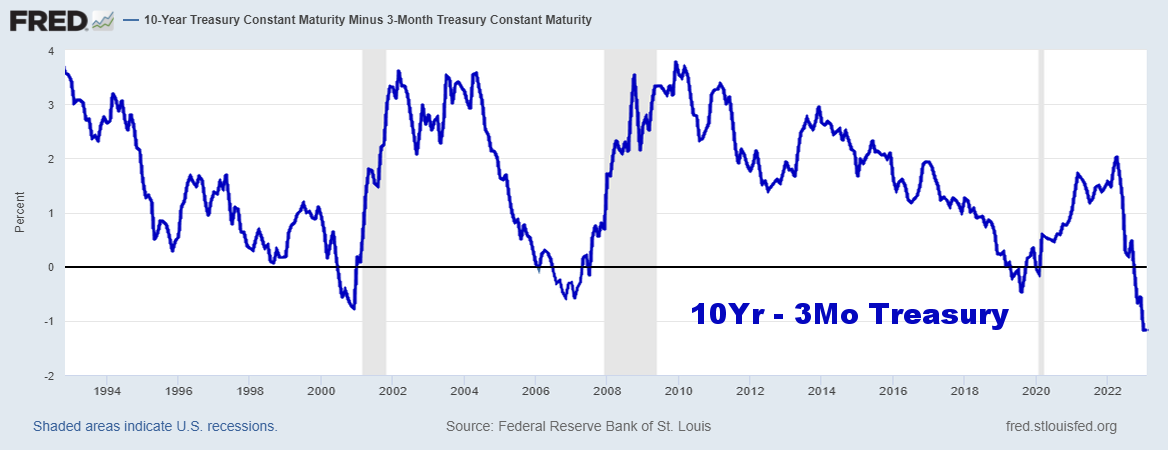
It is said that there is no better predictor of a recession than the inverted yield curve (10-yr. minus 3-mo. treasury yield). An inverted (negative) yield curve may signal that bond vigilantes believe the Fed may soon be forced to reduce short-term rates to rescue an economy headed into a serious recession.
Falling Earnings Forecasts
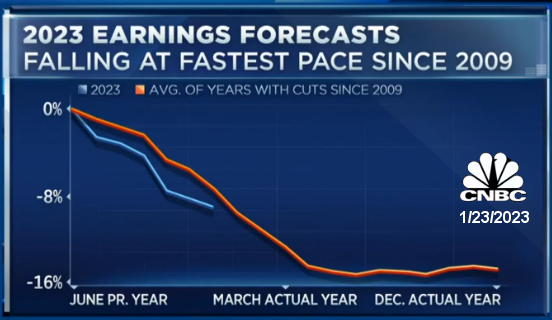
Approximately 90% of a stock’s price has been attributed to its earnings expectations. According to a CNBC interview with RBC’s Lori Calvasina, 2023 earnings downgrades are at the fastest pace since 2009. She expects many more are yet to fall like dominos as downgrades continue spreading to additional sectors. The additional downgrades have yet to affect market prices.
Profile of a Blow Off Top
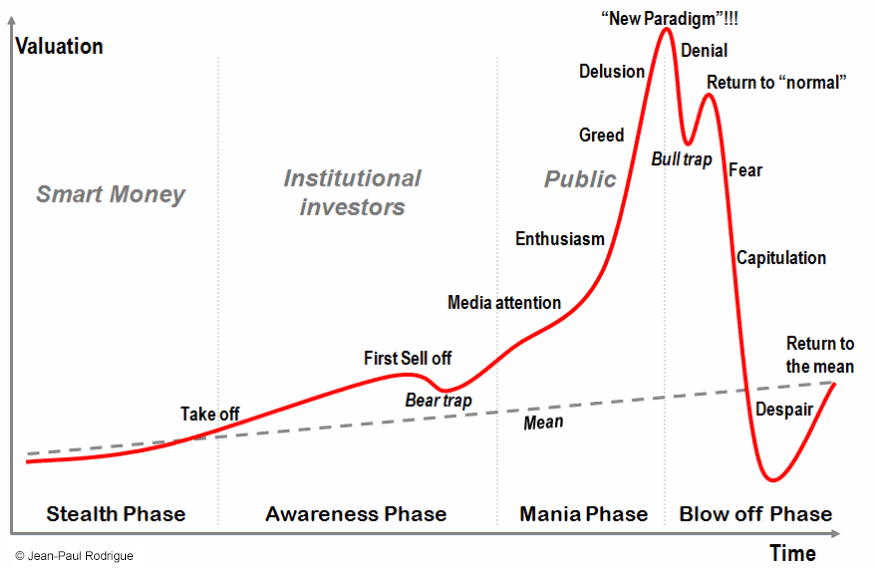
I highly recommend reading “Market Blow Offs: How to Identify and Profit from Bubbles and Crashes,” which describes the phases of a typical market bubble, including the full range of emotional beliefs investors use to defend value throughout the cycle. This can apply to individual stocks, sectors, and whole markets. Unfortunately, most investors buy in late and sell out late. Bear markets are typically twice as volatile as bull markets, making them particularly treacherous. A substantial bear market rally begs the question of whether missing a possible rebound is worse than getting caught in a market-reversing bull trap.
A Breakout Bull or Bull Trap?
In the chart below, the S&P500’s 2001-2002 market crash is plotted in green, the S&P500’s 2008-2009 market crash is plotted in black, and the S&P500’s 2022-2023 market crash is plotted in red – with their market highs aligned. While today’s facts and circumstances are a bit different, how investors react to them is at least somewhat baked into our genes. While there was great fanfare when the S&P500 recently broke through a few levels of resistance, I would note that a redrawing of the upper line of resistance for the 2001-2003 crash would result in an even more serious bull trap and failure to become a new bull market. Indeed “It’s not over until it’s over.”
Patience, not panic! Rules, not emotion!

May the markets be with us,
Disclaimers:
Investing involves risk. Principal loss is possible. A momentum strategy is not a guarantee of future performance. Nothing contained within this newsletter should be construed as an offer to sell or the solicitation of an offer to buy any security. Technical analysis and commentary are for general information only and do not constitute a personal recommendation or take into account the particular investment objectives, financial situations, or needs of any individual. Before investing, carefully consider a fund’s investment objectives, risks, charges and expenses, and possibly seeking professional advice. Obtain a prospectus containing this and other important fund information and read it carefully. SumGrowth Strategies is a Signal Provider for its SectorSurfer and AlphaDroid subscription services and is an Index Provider for funds sponsored by Merlyn.AI Corporation. SumGrowth Strategies provides no personalized financial investment advice specific to anyone’s life situation, and is not a registered investment advisor.


