July 5, 2023
It Ain’t Over ‘Till It’s Over
This wisdom, attributed to Yogi Berra, could apply to both the bear market and the bear market rebound. As I write this, ADP’s National Employment Report was just released indicating that the private sector added 497,000 jobs last month, far more than the 228,000 expected. But seemingly good news turns out to be bad news for the markets. Treasury yields immediately jumped and S&P500 quickly fell 1.2% on market open. Investors believe this will strengthen the resolve of the Fed to further raise interest rates to get control over inflation.
Notably, on the Friday before the 4th of July holiday, a record was set for air travel, mirroring the large employment gains in services (such as hotels and restaurants). Was this a blow-off top in a pent-up desire to travel following the Covid lockdowns, or can the consumer sustain their spending on services? One must also ask if the recent pop in AI stocks will continue or pause until earnings from deployed AI services appear on the bottom line. Meanwhile, ADP reported manufacturing employment contracted. The picture painted by the charts below indicates that a recession is almost certain later this year.
StormGuardTM Pulls Up from the Edge
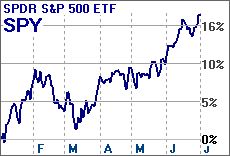
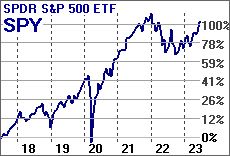
Although StormGuard had been declining last month and threatening to trigger, the successful resolution of the looming budget/default, the media frenzy over AI’s progress, and soaring AI chip sales sent the markets sharply higher and turned StormGuard appropriately higher. Just because a recession may take root later in the year does not mean the market will give up the ghost prematurely. StormGuard will be watching.
StormGuard Rises After Market Pop
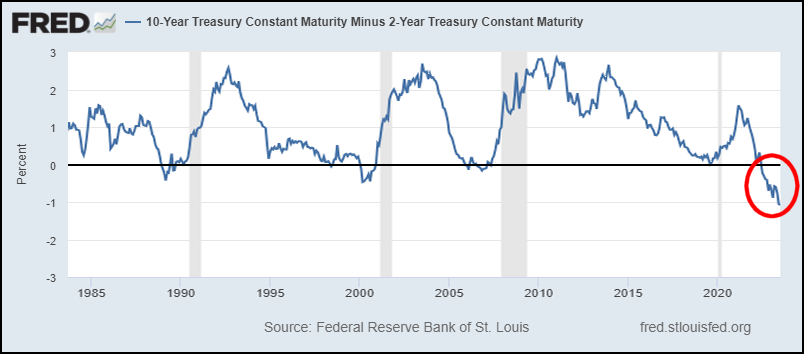
Inverted Yield Curve Lowest in 40 Years
The 10-Year minus 2-Year Inverted Yield Curve goes negative whenever 2-Year Treasuries are paying a higher yield than 10-Year Treasuries and is considered one of the most reliable indicators of a pending recession. Higher short-term rates put a damper on near-term business investment and hurt profitability when business loans are renewed at higher rates – sometimes even making them unable to renew current loans.
10Yr – 2Yr Treasury Inverted Yield Curve
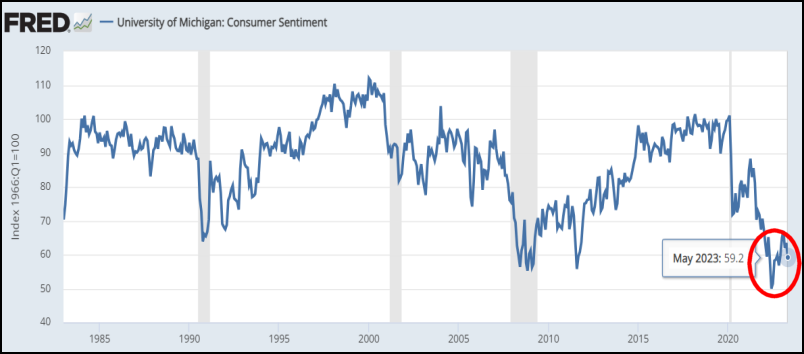
Consumer Sentiment Lowest in 40 Years
A decline in Consumer Sentiment occurs when personal finances tighten and compromises must be made to continue making credit card, automobile, mortgage, and other payments and still have money for groceries, gasoline, entertainment, travel, and other discretionary endeavors. Lower consumer spending eventually leads to lower corporate sales, earnings, and share prices.
University of Michigan Consumer Sentiment
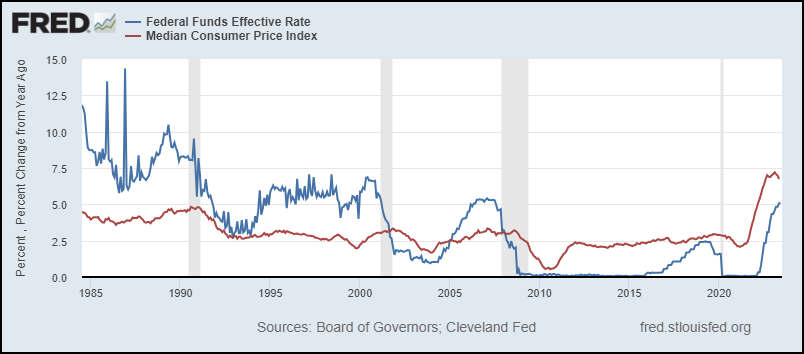
Interest Rates vs. CPI Inflation
While Median CPI Inflation rose sharply in the wake of $Trillions of post-Covid economic stimulation by the Fed and Congres, the Fed has commensurately sharply raised interest rates to put a damper on the inflationary economy. However, some economists suggest that in the past, inflation has not been quelled without interest rates rising above the rate of inflation. Interest rates are currently about 2% short of that mark.
Federal Funds Rate / Median CPI Inflation
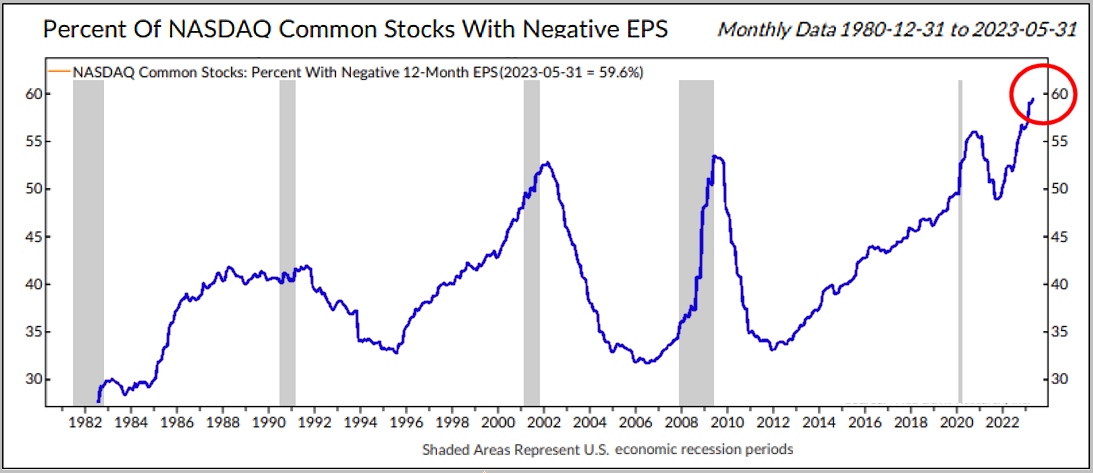
60% Unprofitable Nasdaq Companies
That is stunning! Meanwhile, it has been widely reported that about eight of the largest tech firms are responsible for the lion’s share of the Nasdaq’s performance this year. The stark divergence between QQQ and the MDY was charted in last month’s newsletter. Are these tech giants just masking a broad decline in the market’s underbelly, or are they actually taking revenue share away from them? Perhaps it’s a little bit of both?
Percent of Nasdaq Companies with Negative Earnings
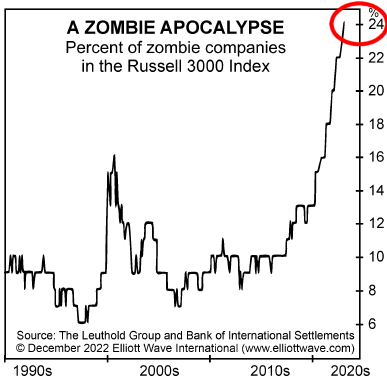
Zombie Companies Everywhere
A Zombie Company cannot meet its business loan obligations through its available earnings and cash and thus may have to be seriously downsized, liquidated, or acquired. This is particularly problematic now because annual loan renewal rates are typically 5% higher than a year ago. Revenue from originating and servicing small business and home loans is also declining and could put some regional banks at risk.
Zombie Companies — Can’t Renew Loans
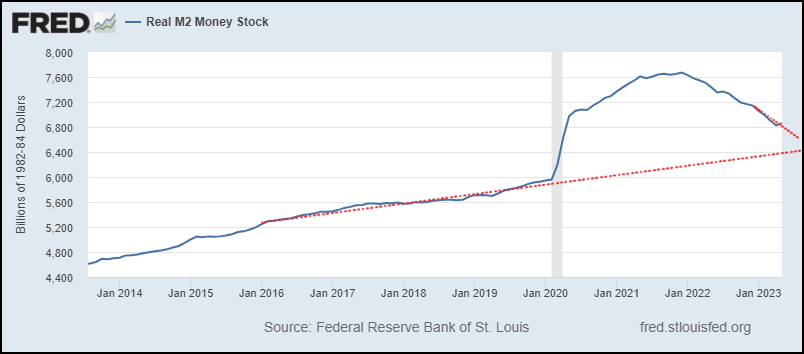
M2 Money Supply Progress
The M2 Money Supply is the available spending money of individuals and companies. Immediately following the Covid Crash the money supply was increased by multiple $Trillions and resulted in inflation (too many dollars chasing too few goods). The Fed is working on reducing the money supply to be in line with the former trend as illustrated in the chart (right). This excess is what has fueled the long and strong bear market rally.
M2 Money Supply – How to Create Inflation
Revolving Consumer Credit
Early into the Covid Pandemic, individuals paid down about 12% of their revolving credit with the pandemic checks sent by the government. But in the last two years revolving has returned to, and aggressively passed through, its former trend. This is consistent with reports that many are more aggressively using their credit cards to help make ends meet in this inflationary environment where wages lag.
Credit Card Debt
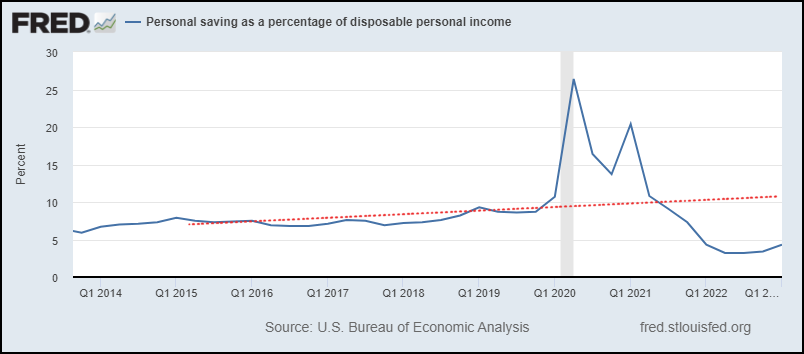
Savings as Percent of Disposable Income
Early into the Covid Pandemic, individuals stashed a portion of the pandemic checks sent by the government into savings, more than doubling the savings rate. Since then savings have precipitously declined and have stabilized at about half of the savings rate before the pandemic. The combination of half-normal savings and record-high revolving credit suggests that many individuals will soon have to seriously cut back on discretionary spending.
Savings as a Percent of Disposable Personal Income
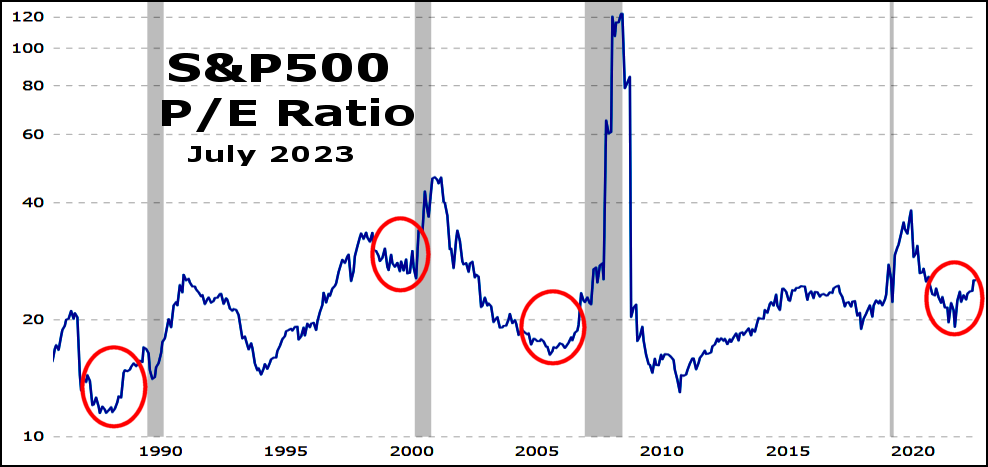
The S&P500 P/E Ratio Isn’t Clueless
It is easy to rationalize that if the S&P500 P/E ratio isn’t abnormally high then it cannot be in bubble territory. However, there are other economic excesses, such as inflation, economic lockdown, credit collapse, rate hikes, and others. In the chart, the current P/E pattern happens to occur just before a recession. Note that each recession is preceded by a P/E/ drop that reverses itself just before the recession. Of course, declining earnings would move the P/E up – and should be expected as a recession unfolds.
Download: NEW Dual Defense PDF
This new descriptive and graphic Dual Defense document simplifies and clarifies how Dual Defense improves the safety of Strategies and Portfolios. We have all heard from Warren Buffet that “not losing money” is more important than making money, particularly in tough markets. So, we doubled down on defense by adding a second methodology to exit equities for defensive positions.
Patience, not panic! Rules, not emotion!

May the markets be with us,
Disclaimers:
Investing involves risk. Principal loss is possible. A momentum strategy is not a guarantee of future performance. Nothing contained within this newsletter should be construed as an offer to sell or the solicitation of an offer to buy any security. Technical analysis and commentary are for general information only and do not constitute a personal recommendation or take into account the particular investment objectives, financial situations, or needs of any individual. Before investing, carefully consider a fund’s investment objectives, risks, charges and expenses, and possibly seeking professional advice. Obtain a prospectus containing this and other important fund information and read it carefully. SumGrowth Strategies is a Signal Provider for its SectorSurfer and AlphaDroid subscription services and is an Index Provider for funds sponsored by Merlyn.AI Corporation. SumGrowth Strategies provides no personalized financial investment advice specific to anyone’s life situation, and is not a registered investment advisor.


