Mar. 5, 2023
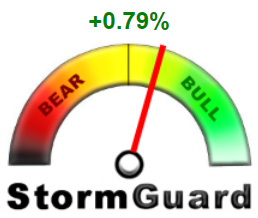
StormGuard Remains Bullish — But For How Long?
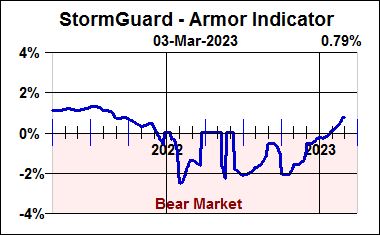
Another bear market rally is currently being served up within a much larger 14-month old bear market. This is not unusual behavior, although it is always a bit different each time. Even though StormGuard has risen precipitously in the past few weeks in response to this bear market rally, it can, and likely will run its course in the next 30 to 90 days and will then further respond to the delayed effects of sharply higher rates for both individuals and businesses.
The Fed made its plan and intentions quite clear to everyone before its first action last year, and has held steady. It plans to continue using its tools for raising rates and reducing market liquidity until inflation consistently and substantially declines. Over the ensuing months the number of missed earnings reports and guidance downgrades will likely slowly increase until both the economy and stock valuations decline commensurately. StormGuard will likely stay near its trigger threshold during this period and thus will be ready to signal such a change.
The Money Supply and Excess Savings
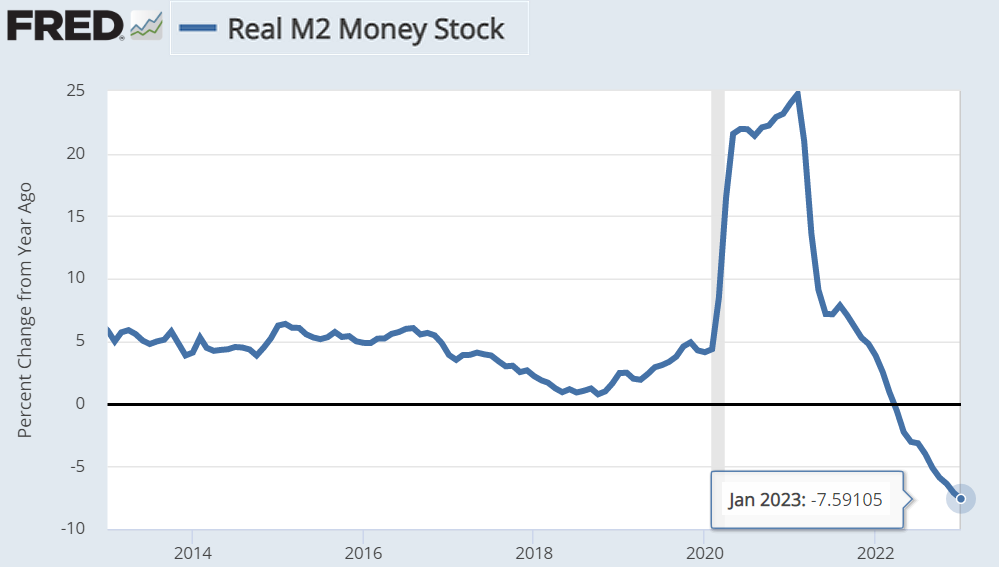
The classic definition of inflation is “too much money chasing two few goods.” The M2 Money Supply chart (right) illustrates the combined result of the Government’s “2020 Covid Cash for Everyone” policy in combination with the Fed’s Quantitative Easing policy which injected an additional $1Trillion per year into the economy.
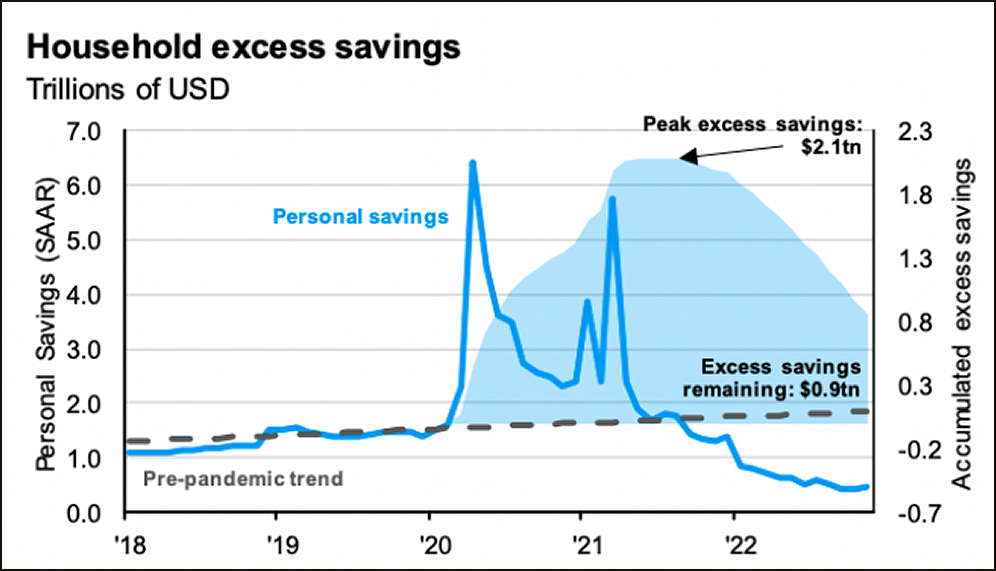
The reduction in the excess savings of individuals illustrated in the chart (right) is caused by corresponding excess spending that tends to drive strong corporate sales and (possibly) inflation – at least until the excess savings is depleted. Thus, the continuing strong corporate revenues that produced the current bear market rally are likely living on borrowed time. When the excess savings become depleted in a few months, corporate revenues will finally take a hit that will propagate through as lower earnings and lower share values.
When excess savings are depleted, it is also more likely that a second wage earner may have to again find employment … but in a stiff-competition layoff environment.
The Fed Sharply Increased the Money Supply for Covid
Excess Savings on Track to be Depleted by June 2023
Not Your Daddy’s Stagflation
Much has been written suggesting that the economy and markets are doomed to repeat the debilitating stagflation period of the 1970s. However, there are multiple reasons why the 1970s stagflation model may not apply today, including:
- Labor Markets: Unionization and collective bargaining have declined since the 1970s, which reduces the likelihood of wage-price spirals.
- Globalization: The growing competitive global economy, helps keep wages and prices in check, thus reducing the likelihood of inflation.
- Energy Markets: In the 1970s, energy prices skyrocketed due to supply disruptions and political instability in oil-producing countries. Despite today’s rocky energy markets, our ability to quickly increase domestic production again if needed means that energy prices are less likely to induce significant further inflation.
- Gold: The US dollar had long been linked to gold, at $32/oz, until 1971. By 1980 gold freely traded at over $600/oz. while other commodities languished. No such analog for any important commodity exists today.
- The Fed: During the 1970s, the Fed had little credibility in its ability to control inflation. Today, the Fed has taken steps to anchor inflation expectations, and (perhaps most importantly) Fed Chairman Powell has made clear his intent not to repeat the mistake of then-Chairman Volker who decreased rates too early and seriously reignited inflation during a recession.
Comparing the 1970s to the 2010s
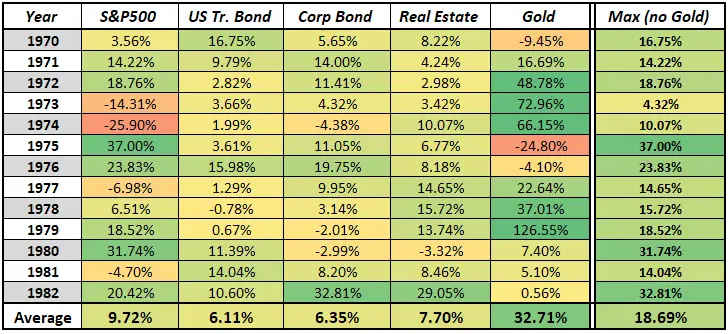
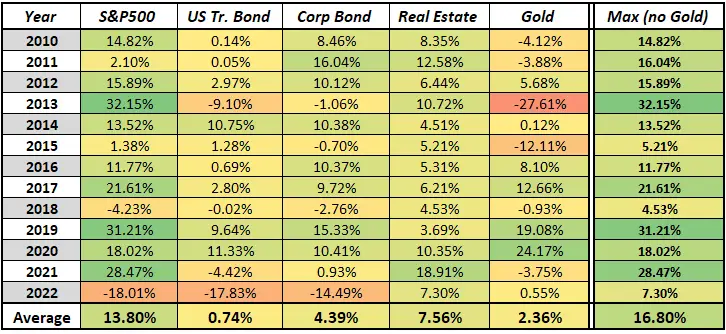
If the character of the economy really is headed back to the 1970s, then examining the market’s differences in character during the two time periods could help us employ appropriate strategies. The two tables below have annual performance data for five different asset classes, each for a period of 13 years, beginning in 1970 and 2010 respectively. The right-most column of each is simply the best-performing of the asset classes (excluding gold). The cells in the bottom row tally the average of the column above them. I additionally examined the charts of numerous commodities other than gold during the 1970s and found none of them worthy of more than a footnote.
What are the Performance Takeaways?
- Gold is the real outlier in the 1970s – but that is almost certainly because gold had just been untethered from the dollar as opposed to having been caused by stagflation.
- The “Max” column averages are not too dissimilar from one another and are both fairly green, indicating that this set of asset classes rotated fairly well. However, there was more value to rotation in the 1970s than in the 2010s, perhaps due to the relatively low returns of bonds and treasuries in the recent period.
Excess Savings on Track to be Depleted by June 2023
Excess Savings on Track to be Depleted by June 2023
Patience, not panic! Rules, not emotion!

May the markets be with us,
Disclaimers:
Investing involves risk. Principal loss is possible. A momentum strategy is not a guarantee of future performance. Nothing contained within this newsletter should be construed as an offer to sell or the solicitation of an offer to buy any security. Technical analysis and commentary are for general information only and do not constitute a personal recommendation or take into account the particular investment objectives, financial situations, or needs of any individual. Before investing, carefully consider a fund’s investment objectives, risks, charges and expenses, and possibly seeking professional advice. Obtain a prospectus containing this and other important fund information and read it carefully. SumGrowth Strategies is a Signal Provider for its SectorSurfer and AlphaDroid subscription services and is an Index Provider for funds sponsored by Merlyn.AI Corporation. SumGrowth Strategies provides no personalized financial investment advice specific to anyone’s life situation, and is not a registered investment advisor.


