
Nov. 21, 2023
Has the Fed’s Soft Landing Arrived?
The market’s volatile decline in October stretched negative sentiment fairly tight and set up the market for a strong relief rally that was finally triggered by the Fed on November 2nd when it didn’t further hike rates. Bond markets speculated that this was now close enough to the top that it was time to start betting on a decline in rates later in 2024. Investors predictably responded to the slight decline in long-term bond yields by driving equities sharply higher. One week later, CNBC reported that many traders were worried that November’s strong start was just massive short covering and may turn out to be just a mirage.
Although StormGuard had been triggered and made defensive selections since the end of September, on November 9th StormGuard reported: “A strong market rebound of over 6% that makes a new high in over 6 weeks is a signal that indicates to Get-Back-in-Early without waiting until month end as a renewed bull market appears to have taken hold and neutralizes any other conflicting StormGuard-Armor triggers.”
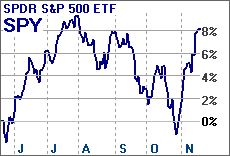
6 Months
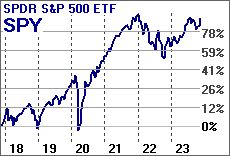
6 Years
Whether it is a new Bull or the last Hurrah before the long-awaited recession is arguable and will only truly be known as many factors play out. Retail holiday spending may falter. Rising credit card balances and interest rates appear problematic. While the past few years proved that excess government spending both pumps the markets and leads to inflation, it’s not clear today whether they will (or will not) continue to do more of the same. We are about to see if this is more than a short covering mirage.
Markets, StormGuard: About Face!
While StormGuard reflects what investors are already doing and are likely to continue doing, markets can turn on a dime when new information changes the outlook. The combination of the Fed canceling a generally expected rate hike and a slight uptick in unemployment (where bad news is good news) was enough to change the game.

StormGuard Does an About Face
The Institutional Momentum and Value Sentiment Indicators (below) are two of three primary components that can trigger StormGuard. The first evaluates the importance of institutional trading volume, whereas the second evaluates the importance of the relative number of new highs and new lows to ascertain a change in investor behavior. Since September both have been negative and declining.
Although they are still negative, both have just started to turn up. Indeed, the question for December is to resolve whether this rebound is more than a short-covering mirage. Will it be supported by robust Christmas spending? Will our Washington politicians continue to juice the economy with excessive deficit spending? Or, will it prove to be the last gasp before the “most telegraphed recession in history?” Stay tuned!

Volume Trading Bias Indication

Highs/Lows Sentiment Indication
Credit Card Interest Rates
Consumer spending has thus far remained fairly steady in the face of both declining personal savings and consumer credit now climbing above its pre-COVID highs. Perhaps the more worrisome thing is that credit card interest rates have risen to more than 21% – nearly double their pre-COVID lows. Consumers feeling flush due to the recent rebound may push markets even higher – at least until credit cards must be paid.

Credit Card Interest Rates
Sticky Inflation Still 5%
The Fed’s preferred inflation measurement, called “sticky inflation,” tracks items that usually change in price relatively slowly, such as wages, insurance, and rent. The broader “headline inflation” has come down further, but may be as transient as it was in the late 1970s. The Fed’s “higher for longer” rhetoric is tied to Jerome Powell’s commitment not to repeat the overly optimistic policies of that period that allowed inflation to get out of hand.

Sticky Inflation Still at 5%
The Sahm Recession Indicator
The Fed’s Sahm Recession Indicator signals the start of a recession when the three-month moving average of the national unemployment rate rises by 0.50 percentage points or more relative to the minimum of the three-month averages from the previous 12 months. It is believed that when unemployment quickly begins to move higher that larger forces driving unemployment have already taken root. The indicator has less lag and fewer false positives than others in common use. The indicator is now rapidly approaching its threshold.
The Sahm Indicator with the S&P500 and Recession Periods

What Does it All Mean?
We all know that a fair price is determined when a willing buyer meets a willing seller. While “smart money” and “dumb money” may both exist, there is clearly no shortage of qualified smart money pointing in both directions. There are things we know that we don’t know – such as how the Israelis and Ukraine wars will affect world economies. But more insidious are the things we don’t know that we don’t know.

While the Fed sparked hope for an earlier than anticipated 2024 decline in interest rates and a short squeeze rally likely piled on, we are a long way from being out of the woods. The Fed’s interest rate noose eventually causes unprofitable companies to fail, business investment to slow, and further debt-based consumer spending to decline. Keeping rates higher for longer is not a plan for locking in a new bull market, but rather is a plan to deliver the painful medicine required to truly tame inflation.
Patience, not panic! Rules, not emotion!

May the markets be with us,
Disclaimers:
Investing involves risk. Principal loss is possible. A momentum strategy is not a guarantee of future performance. Nothing contained within this newsletter should be construed as an offer to sell or the solicitation of an offer to buy any security. Technical analysis and commentary are for general information only and do not constitute a personal recommendation or take into account the particular investment objectives, financial situations, or needs of any individual. Before investing, carefully consider a fund’s investment objectives, risks, charges and expenses, and possibly seeking professional advice. Obtain a prospectus containing this and other important fund information and read it carefully. SumGrowth Strategies is a Signal Provider for its SectorSurfer and AlphaDroid subscription services and is an Index Provider for funds sponsored by Merlyn.AI Corporation. SumGrowth Strategies provides no personalized financial investment advice specific to anyone’s life situation, and is not a registered investment advisor.